Let’s talk about the 6-ton elephant in the room, economic demand destruction. The ongoing COVID-19 pandemic and simultaneous oil price war have joined forces to drive a sector-wide commodity sell-off. As cities and states across the U.S. have begun issuing unprecedented measures to contain the spread of the virus (today, Governor Cuomo of New York issued an executive order stating that all non-essential workers must stay at home), there has been significant speculation about the impact of the COVID-19-related downturn on electricity demand.
To establish a baseline expectation, EVA reviewed data from the market crash of 2008-2009 and found that between October 2008 and September 2009:
- U.S. weather-adjusted power demand declined by 3% while weather-adjusted gas demand (res/com + industrial) declined by 2%
- Industrial demand for electricity fell by 9% while industrial natural gas demand fell by 8%
One important note is that the sharp decline in natural gas prices from 2008 to 2009 likely offset some of the economic impact of the crash.
- EVA expects net weather-adjusted electricity demand to fall by 5-7% through the summer months if COVID-19 persists.
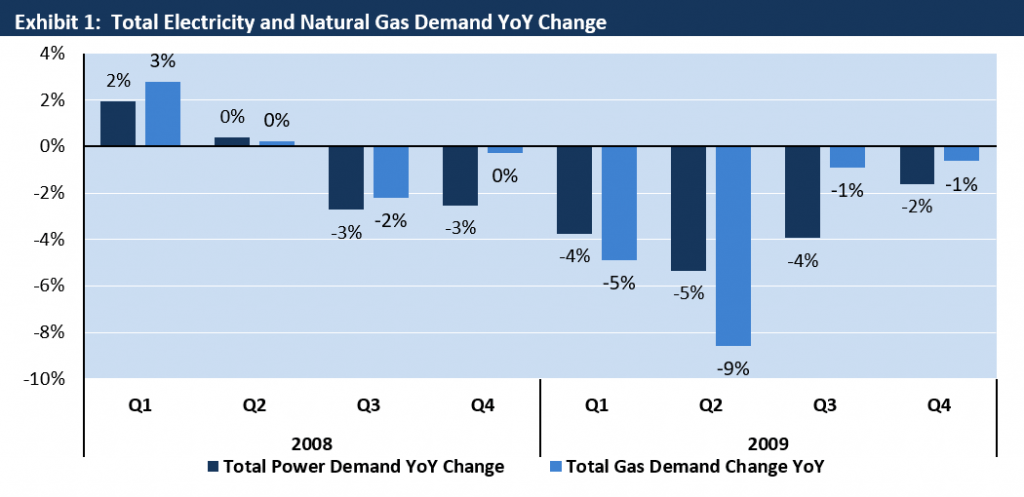
During the last market crash in 2008, which was ignited by the collapse of Lehman Brothers on September 15th, total electricity demand fell by roughly 3 percent and gas demand fell by 2 percent YoY. As the economy slipped deeper into recession, electricity demand fell further, with Q2 2009 experiencing a ~5% drop and an associated 9% drop in total natural gas demand YoY (see Exhibit 1).
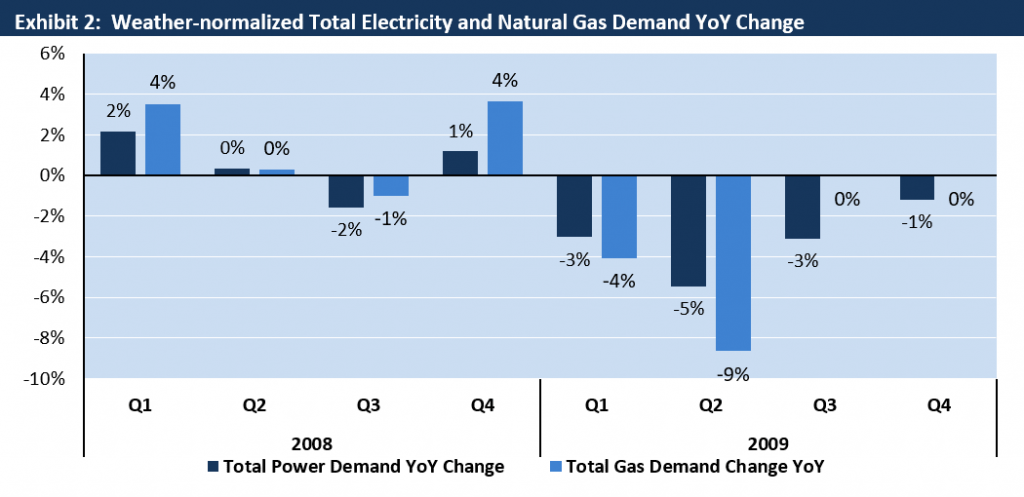
Adjusting for weather, the decline in power demand following the market crash was less significant. In Q3 of 2008, power demand fell by just shy of 2% and gas demand fell by roughly 1% YoY. In Q4 of the same year, weather-adjusted gas demand grew by 4% YoY (see Exhibit 2).
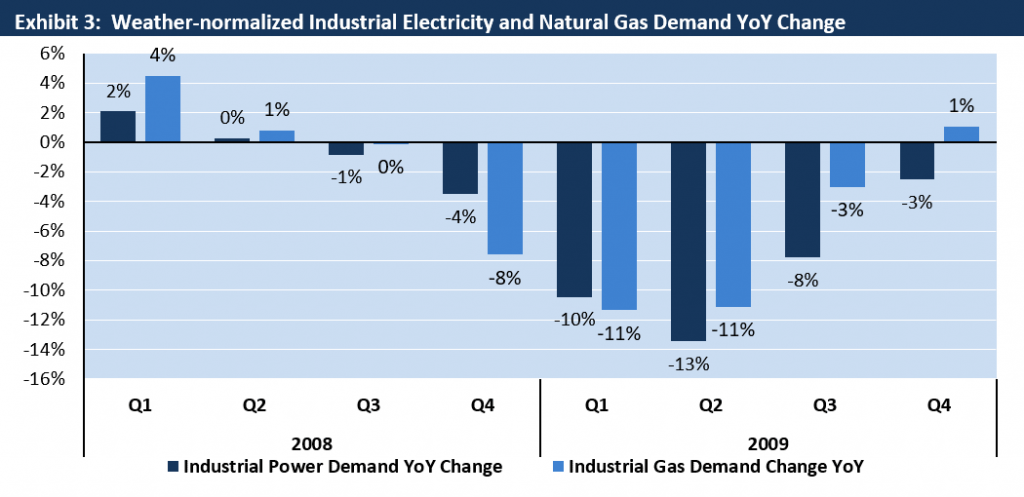
Naturally, impact across sectors was not uniform, and EVA does not expect uniform impacts during the ongoing crisis. In 2008, weather-adjusted industrial demand for power and gas were relatively unaffected in Q3 but subsequently experienced a fairly major downturn that lasted through Q3 of 2009 (see Exhibit 3).
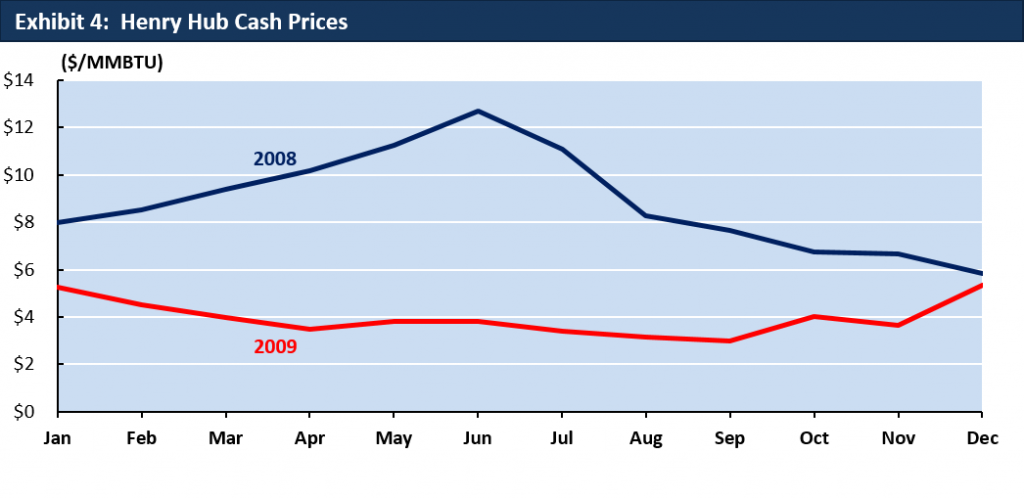
Gas pricing was an important factor in aggregate demand. Gas prices fell from highs of nearly $13.00/MMBTU in 2008 to troughs of roughly $3.00/MMBTU in 2009 (see Exhibt 4). This precipitous decline likely mitigated some of the economic impact of the financial crisis.
Looking forward using the lens of the 2008-2009 crash, EVA expects electricity demand from the industrial sector to fall by up to 10%, which will be somewhat offset by residential demand gains related to self-imposed quarantine and mandated shelter-in-place orders that will keep people in their homes. That being said, EVA estimates that there could be additional losses from the commercial sector given the broad near-term impact of COVID-19 on all commercial industries. Overall, EVA expects that there will be a net reduction of roughly 5-7% in weather-adjusted demand declines if COVID-19 shelter-in-place orders last deep into the summer months. If the timeline is shortened, EVA’s estimates for demand losses are significantly reduced as the industrial and commercial sectors revert to business as usual.
Given that 86.5 GW of CCGT capacity has been built since 2007, there is significant upside for the low gas prices to fuel strong power burns and potentially take incremental market share from already-struggling coal plants.
EVA’s position is that there is likely to be some economic demand destruction, but it’s unlikely that it will be as significant on a weather-adjusted basis as the latest dramatic headlines suggest—particularly as natural gas prices remain low enough to incentivize power burn. Domestic oil and gas production as well as the magnitude and duration of energy end user behavior change will be key determining factors as EVA continues to monitor the market impacts of COVID-19.
To read about how COVID-19 and the oil price war are impacting renewables in the permian read this post. To learn about EVA’s 2020 coal and gas burn forecast check out our Gas & Coal Price Sensitivity Outlook or read the highlight from our March edition of the report.


