


The January-February 2020 Liquefied Natural Gas (LNG) market saw a lot of gas and not a lot of buying. Here are some of the dynamics we’re watching as the month comes to an end:
Prompt Month Spot Price Dynamics
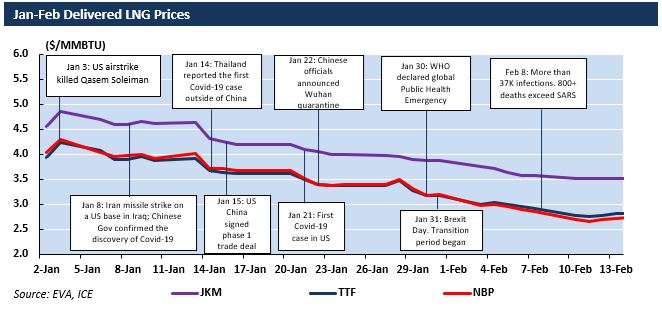
The JKM LNG index for March LNG deliveries to Northeast Asia averaged $4.08/MMBTU over the 30 days before expiration (Feb 14th) before ultimately settling at $3.53. NE Asia prices hit a record low with mild weather and the outbreak of Covid-19. Dutch TTF and British NBP averaged $3.43/MMBTU during the same period and settled (Feb 20th) at $3/MMBTU. Primary Asia and Europe LNG indexes fell 23% and 30% from the beginning of 2020, respectively. Asia-Europe spreads grew from the end of 2019 to mid-Jan and then started to see significant volatility.
Near-term LNG Market Movers
The following events are the key Jan-Feb 2020 developments that EVA believes will continue to influence the near-term LNG market. (To read about LNG market dynamics in 2019 click here.)
COVID-19 continues to spread market fears of oversupply
The outbreak of Covid-19 has triggered turmoil in the Asian LNG market, which was already experiencing historic low prices. At the time of writing, China has reported nearly 55,000 cases and Japan has confirmed over 700 cases. In addition to falling demand, costumers requesting cargoes deferrals sparked disagreements over delivered prices, which added additional uncertainties to Pacific markets. The opportunities to redispatch excess supply to Europe are currently limited by because continental storage is 50% higher than it was at the same time last year. However, Chinese demand could still maintain some resilience as the major LNG offtakers along the coast are not among the regions hit hardest by the virus.
US-China trade deal and potential tariff exemptions to spur Chinese US LNG import
The LNG market could see some upside as China committed to purchase 50+ billion tons of US energy products, including LNG in US-China phase 1 trade deal. China recently started to accept applications of tariff exemption for goods including LNG. The potential removal of the existing 25% tariff could bring US LNG a substantial growth of buying interest. However, the impact of the virus is currently overshadowing US-China energy trade.
Escalating US-Iran tensions threaten secure energy flows through key choke-point
The deterioration in US-Iran conflicts could lead to disruptions of Qatari LNG supply if Iran retaliates by halting shipment through Straits of Hormuz. The cutoff, which would admittedly be extremely dramatic from a geopolitical standpoint, would create a major supply shock to Qatar’s major destinations in Asia and shift up regional spot prices.
Collapse of LNG shipping rates amid high vessel supply
Charter rates for LNG vessels fell by 50% since the start of 2020 as demand dimmed due to mild global temperatures, discharge delays in China, and high European storage. 10 VLCC tankers owned by CNOOC were relieved from US sanctions in January. With the extra supply, spot charter prices are expected to drop further. US LNG Shipping costs are sensitive to charter rates due to the high tonnage mileage to primary delivery ports. Declining freight could incentivize sales of US LNG to South and Central America, especially with depressed Henry Hub prices.
January Trade Highlights
In January 2020 global LNG trade reached 32 million metric tons (MMT), a 4% increase YoY. Asia and Europe received 23.2 and 7.6 MMT, respectively. Australia surpassed Qatar and continued its streak (that started in Dec-19) as the largest exporter in Jan-20.

JKT demand remained comparable to last year at 7.3 MMT while Chinese dropped 8%. Other regions in Asia grew 8% in LNG import. Australia and Qatar are still the primary suppliers, altogether occupying over 60% of the Pacific market, followed by the US and Russia.
Western Europe imported 22% more LNG than Jan-19. Meanwhile, its intra-continental reexport also grew rapidly this winter. January gas storage was averaged 80% full across Europe.
The North Africa region’s LNG exports dropped 75% YoY primarily driven by Algeria’s declining gas production. A new law in Algeria aims to cut the tax burden on energy asset owners came into effect in January. The new regulation is expected to attract more investment and restore production. Meanwhile, Egypt exported 0.25 MMT of LNG— nearly doubled that of last January, with increasing gas output from the Zohr field.
