


The U.S. Energy Information Administration (EIA) recently released its Annual Energy Outlook for 2017 (AEO 2017), which provides projections through 2050. One of the more interesting results from this year’s release is the EIA’s reference case projection of an enormous increase in long-term solar PV capacity in the Southeast.
Utility-scale solar PV capacity in the U.S. has expanded rapidly over the past several years, climbing from 1.6 GW in 2011 to an estimated 19.7 GW by the end of 2016 (rooftop PV capacity has also increased, but this article focuses only on utility-scale installations).
One driver of the utility-scale solar capacity expansion has been the federal Investment Tax Credit (ITC) that provides a one-time tax credit equal to 30% of the total solar project costs. Yet, despite the ITC being available in all states, solar capacity remains heavily concentrated in a few key markets, with nearly 50% of capacity in California alone. Only three states have more than 1 GW of installed solar PV capacity, while 27 states have less than 5 MW.
Solar development has been particularly slow to non-existent in the Southeast, a somewhat unexpected outcome given the region’s high quality solar resource. South Carolina, Alabama, Mississippi and Louisiana all have less than 70 MW of installed capacity, while Florida and Georgia have slightly more (261 MW and 914 MW, respectively).
Much of this solar concentration is directly attributable to special state solar incentive programs, most notably state Renewable Portfolio Standards (RPS). Currently, 29 states plus the District of Columbia having binding RPS programs, which require a set amount of retail electricity sales to be supplied by qualifying renewable energy resources.
The Southeast, however, is largely void of RPS programs. The region also offers PURPA “avoided cost” rates that have, thus far, been too low to support new solar PV projects to move forward as Qualifying Facilities (QFs).
In the Southeast, only North Carolina has an RPS, requiring 12.5% of sales to be sourced from renewable energy by 2021. Until 2016, the state also offered a 35% ITC for solar projects, to be used in addition to the federal ITC. As result, North Carolina is the only state in the region with significant solar PV capacity, totaling 2.1 GW as of end-2016. In neighboring states without an RPS or other incentive programs, solar developers have been largely unable to offer PPAs below PURPA-based avoided cost rates.
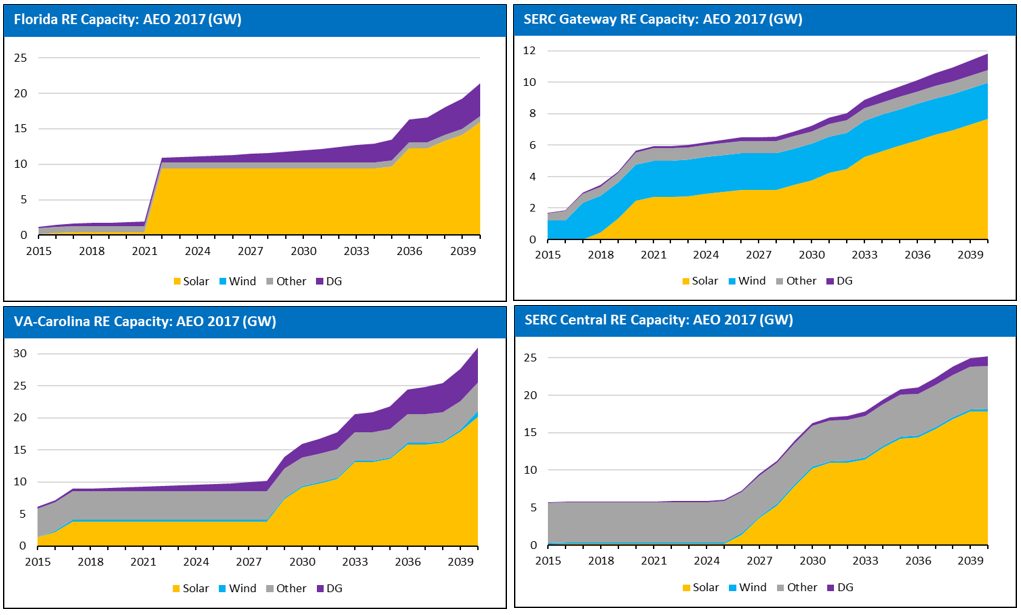
Given the poor existing solar market conditions in the region, it is somewhat surprising that AEO 2017’s reference case projects that of the 93 GW of new solar PV capacity additions between 2015-2040, 78.4 GW (or 85%) of that capacity will be built in the Southeast. The graphs below show the AEO projections for four of the six southeastern modeling regions.
These results are well above EVA’s long-term projections and indeed, are well above those from EIA’s AEO 2016, as well. Given the magnitude, the numbers merit a closer look.
The most important caveat is that the AEO 2017 reference case incorporates EPA’s Clean Power Plan (CPP), which is now likely to be abandoned. There is little doubt that the CPP spurred a significant portion of the modeled new solar build activity. AEO 2017’s No Carbon case, for example, projects only 58 GW of new solar PV, versus 93 GW in the reference case. No regional breakout was provided for the No Carbon case, but a large chunk of the variance is likely in the Southeast.
Yet beyond the CPP, there are two other drivers of solar PV capacity additions in the region that may persist even without carbon legislation. The first is EIA’s assumption for continued declines in solar PV costs, which are projected to fall from ~$2,100/kw in 2016 (excluding ITC) to $1,500/kw in 2040. If costs do reach that level, solar developers in the Southeast may be able to offer PPAs competitive with other technologies or PURPA avoided cost rates.
The other remaining driver for solar PV growth in the Southeast (especially post-2030) is the projected retirements of nuclear and coal capacity. In AEO 2017, much of this capacity is modeled to be replaced with solar PV. Replacement of a baseload capacity with highly variable solar capacity could present some grid reliability challenges. Further, in a No Carbon case, it is likely that CCGTs will remain a lower cost option than solar PV in the region—unless, solar PV costs fall more dramatically than EIA predicts.
Thus, while solar PV does offer some promise in the sunny Southeast, a closer look at AEO’s reference case projections suggests they are likely overly optimistic.