National Summary:
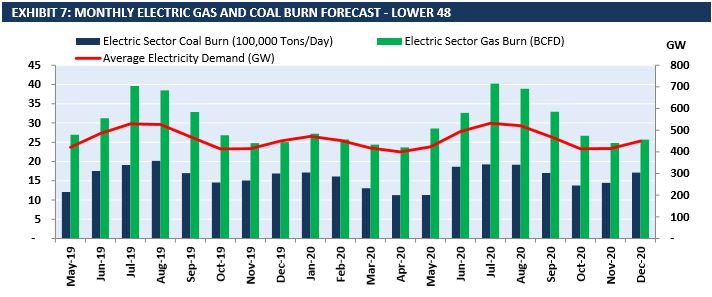
Gas burn in February actualizing at a record 27.35 BCFD, nearly 0.6 BCFD higher than in January and 2.4 BCFD higher YoY. Coal burn was relatively flat YoY for February, while hydro generation declined by 13.5% from last year. Exhibit seven demonstrates that gas burn is expected to remain around 27 BCFD through May before jumping about 30 BCFD per month as we exit the spring shoulder season.
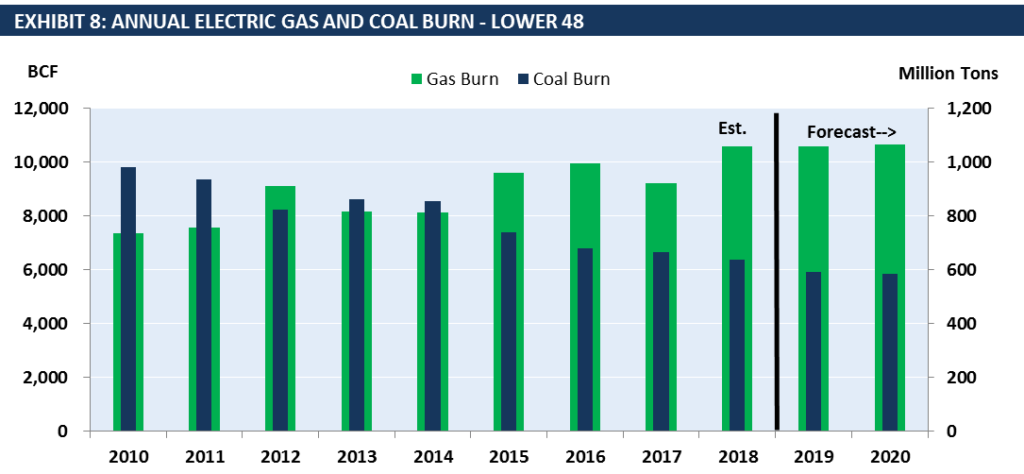
EVA’s annual forecast, as depicted in exhibit 8, expects gas and coal burns to remain flat through 2020—with coal burn remaining below 600 million tons per year for the foreseeable future.
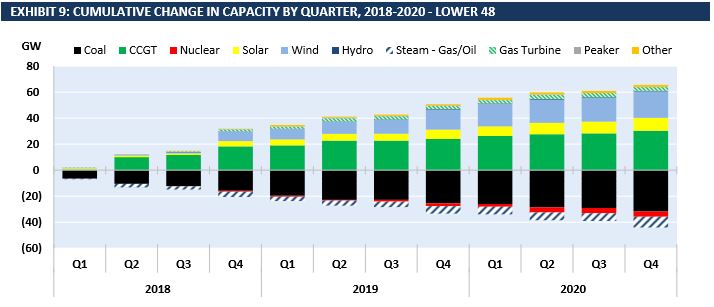
After adding significant gas installs in the last few quarters, wind capacity installs are expected to accelerate through the end of 2019. Renewable build out and bearish electricity demand are two driving factors in EVA’s flat gas burn forecast. Exhibit 9 illustrates EVA’s expected timing for capacity additions and retirements through the end of 2020.
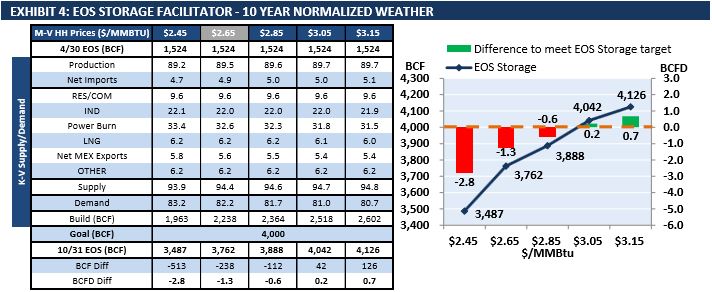
On the gas storage side of things, EVA’s storage facilitator (exhibit 4) indicates that end of season storage will reach 3.76 TCF based on current forward gas prices and the supply and demand balance. At 3.76 TCF storage is below the nominal 4.0 TCF ceiling. Gas prices will need to rise by 40 cents for storage levels to reach 4.0 TCF.
ERCOT Spotlight:
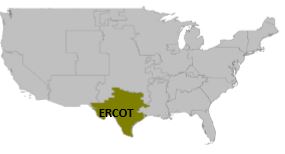
This month’s spotlight focuses on ERCOT ahead of another record-breaking summer. After the PUCT changed pricing mechanisms to increase reliability during the summer months, NRG announced that it plans to restart its inactive 385-MW Gregory CCGT plant. The RTO expects peak demand to surpass last summer’s record-breaking peak of 73,473 MW.
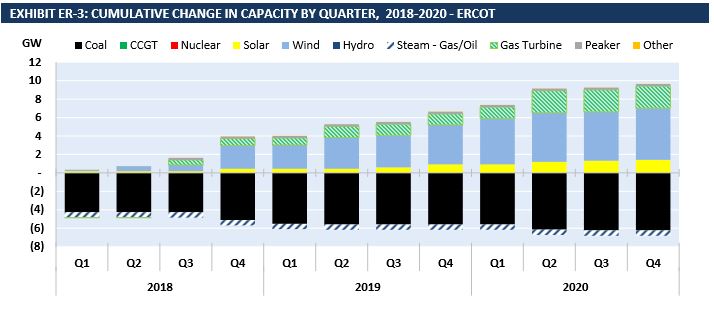
In February, ERCOT coal generation was up 5%, while gas generation was down 6% YoY. Stronger wind generation took away market share from gas. Wind’s share of total generation grew to 21% for the first two months of the year. Exhibit ER-3 shows how wind capacity increased significantly during Q1 of 2019 in the region. Wind capacity is anticipated to continue to grow at a steady rate as several more gigawatts of capacity should come online before the end of 2020.
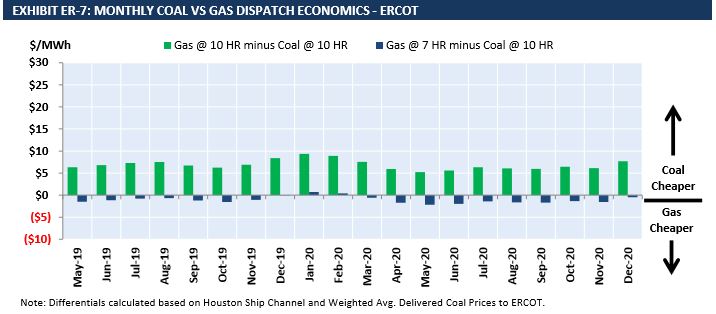
Although Gas generation declined YoY in February, annual gas burn is set to increase by 4.5% YoY. Low gas prices are a major factor in gas burn’s growth. Exhibit ER-7 reflects that at a heat rate of 7 gas is expected to be cheaper than coal for most of 2019 and 2020.
EVA’s Gas and Coal Sensitivity Price Outlook is a one-stop shop to understand the impact of competition between natural gas and coal in the U.S. power markets. The report is based on EVA’s proprietary scenario analysis of modeled assumptions which provides high-level insight into a wide array of market-driven outcomes. For more information on our Gas and Coal Price Sensitivity Outlook, or to find out more about our gas, coal, or power analytical products please contact Robert DiDona at [email protected].


