


Following a mild start to this winter, cold weather finally arrived in late-December, with a record-breaking freeze sweeping down from Canada and spreading across nearly the entire U.S. east of the Rockies. The blast of cold has had an immediate impact on the market, causing production freeze-offs, surging heating demand and spiking gas and power prices.
This stretch of freezing temperatures is far more severe than anything from the past two winters and has, naturally, drawn comparisons to the vaunted “Polar Vortex” during the 2013-2014 winter. However, this special report reveals two critical differences between the two events. First, while the current cold stretch is actually more severe than the Polar Vortex, the weather outlook calls for a return to above-normal temperatures over the next few weeks. In contrast, temperatures in 2014 remained brutally cold for several weeks after the Polar Vortex.
Second, current gas market dynamics—most notably, higher production levels—have generated comparatively little concern over the possibility of a fundamental undersupply. Indeed, the market currently sees oversupply as the more likely concern. This, combined with the prospect of warming temperatures ahead, have managed to keep forward curves below $3/MMBTU—largely unchanged from levels heading into winter. In contrast, the Polar Vortex generated forward curves consistently north of $5/MMBTU.
Where We Were in January 2014: The Polar Vortex
For reference, it’s helpful to recall the market dynamics during the Polar Vortex. During the four gas weeks of January 2014, extreme cold weather resulted in a cumulative Total Degree Days (TDDs) of 897—some of the highest levels on record. As a result, storage withdrawals surged, actualizing at 791 BCF, more than 100 BCF above subsequent withdrawals during the same time period in 2015 and 2016. The gas week ending January 10, 2014 was the single coldest gas week since the beginning of the shale gas-era, registering 276 TDDs and posting a record-breaking storage draw of 288 BCF.
While the vortex itself lasted only a few days, subsequent stretches of brutally cold weather plagued the eastern part of the country through February and into March. These extreme conditions on the demand side were exacerbated by the fact that gas production at the time was a full 10 BCFD lower than current levels, and pipeline constraints were far more acute.
Granted, LNG exports had not yet begun, and pipeline flows to Mexico were far lower (1.7 BCFD vs 4.3 BCFD). Yet still, the combination of persistently cold weather and lower production produced overall gas market dynamics in 2014 that were more constrained than they are now. As a result, the impacts of the Polar Vortex were more sustained than is likely to be the case for the current situation.
Where We Are Now: The Arctic Outbreak
Fast forwarding to this winter, the current cold event is easily the most significant weather event to hit the gas market since the Polar Vortex. Yet, the two meteorological phenomena are not as similar as they may appear. The cold weather experienced through early January (i.e., gas week ending January 4) will likely actualize colder than the record-setting gas week of January 10, 2014—the peak of the Polar Vortex. Early estimates for withdrawals for this week are more more than 300 BCF. Cash gas prices in many regions have spiked to record levels, including $140/MMBTU at Transco Zone 6 in New York.
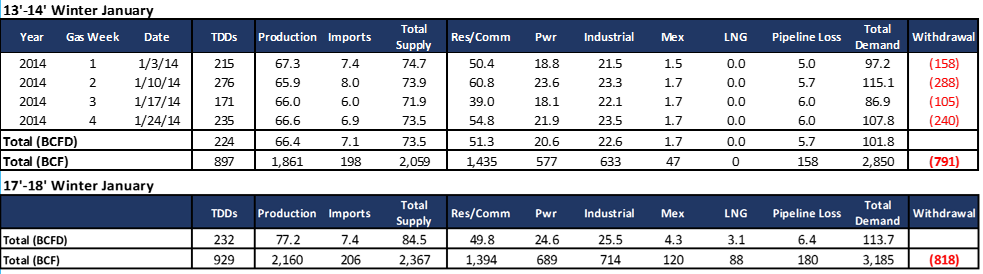
Despite high cash prices, our monthly Gas-Coal Price Sensitivity report projects January 2018 power burns to actualize 4 BCFD higher than during January 2014. Additionally, structural demand gains stemming from the export sector have also ramped up.
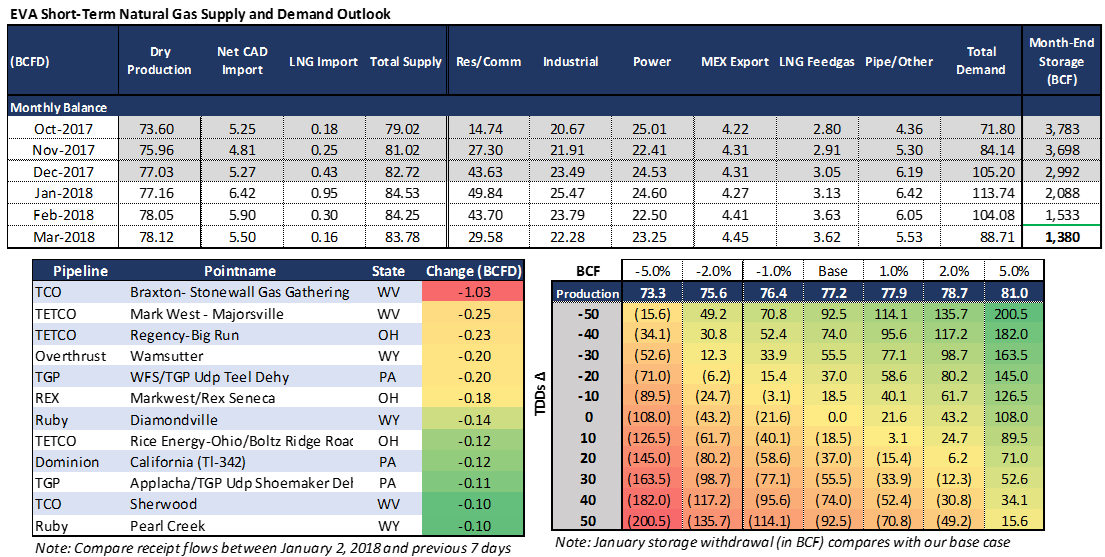
Yet, despite the extreme conditions and structural demand increases, activity on the forward strip remains rather subdued compared to 2014. In no small part, this is driven by considerable increases in gas supply over the past several years. Gas production is currently hovering near 76 BCFD, 10 BCFD above production levels sustained during the 2014 winter. Further production gains are expected through the winter and into spring.
However, the most critical driver of persistently stable forward curves is the weather outlook for the next few weeks, which calls for the imminent return of normal weather, including the prospect of above-average temperatures in many regions. The winter of 2014, in contrast, featured the exact opposite weather scenario, with temperatures holding below normal for several weeks. As a result, while January 2018 storage withdrawals are likely to exceed 2014 levels, EVA still expects end-of-season storage levels for 2018 to be nearly .6 TCF above 2014 winter walk-out.
Uncertainties Persist for 2018 Winter
While the forward market response thus far has been more subdued, there remains a few key points of uncertainty that will affect storage withdrawal, summarized in the bottom right table below.
First, production could disapp oint. Output has already fallen about 4-5 BCFD over the past five days due to sub-freezing temperatures and the corresponding freeze-offs. Declines have been concentrated in the Northeast and the Rockies (see bottom left chart below), and while early indications suggest a steady return, it could still take several days for production to bounce back to normal. On the other hand, pipeline takeaway capacity as well as recent high regional pricing (i.e. Dominion South hub) could provide some upside for production in the near future.
Second and most importantly, the weather outlook could be wrong and could turn far colder. If it does, the greatest impact would of course be on the Res/Comm sector, but other sectors (including power and industrial) could be impacted, as well.
Despite these uncertainties, the market has a long way to go before reaching the supply-demand balance that governed the response to the 2013-2014 Polar Vortex winter. Per usual, weather will remain the key factor but at present, there is little fear of spiking forward curves.