


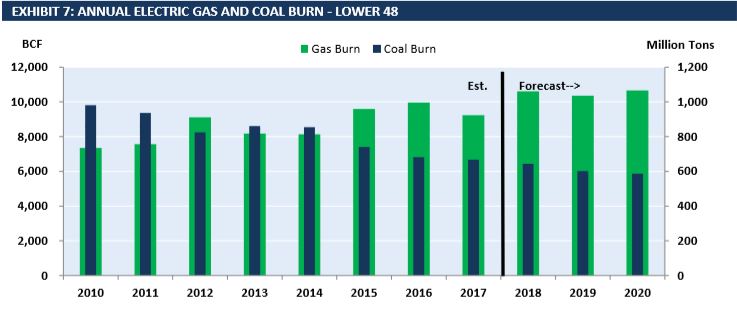
EVA’s Monthly Gas & Coal Price Sensitivity Outlook forecasts that 2018 will end with Lower-48 coal burn at 644 million tons. 2017 annual power-sector coal burn was 666 million tons– 22 million tons more than in 2018. Going into September, coal burn was expected to fall by 25 million tons YoY. However, higher cash and forward gas prices have buoyed coal through the end of 2018. On the gas side of things, EVA analysis believes that power-sector gas burn will reach ~29 BCFD in 2018. Even with high-expected gas prices for January, EVA forecasts that gas burn will actualize higher YoY at ~29 BCFD. Exhibit 7 from the national section of the report highlights these recent findings and the 2019 and 2020 forecasts.
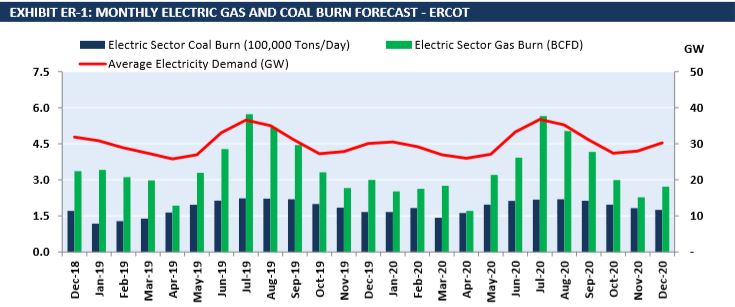
Even in a high gas price environment, power-sector gas burn is likely to reach ~ 26 BCFD this January as a result of structural growth in gas, coal retirements, and low coal stockpile levels. In discussion of the report EVA Senior Gas Analyst, Mengjun Yu, highlighted that the data on gas-to-coal switching is somewhat misleading. Looking at ERCOT, where the share of coal increased and the share of gas decreased relative to total generation, it might seem that the data suggests that coal and gas prices were deciding which resource was utilized to a greater extent. Yu pointed out that ERCOT gas generation has more closely followed demand and coal generation has been relatively flat. So, as demand for electricity decreased gas generation decreased– leading to the appearance of gas-to-coal switching. Yu suggested that the market dynamic seems to be dictated by both price and gas generation’s ability to dispatch more flexibly than coal generation. The report’s Exhibit ER-1 (below) depicts the interplay between power-sector coal and gas burn as ERCOT demand fluctuates. The full 2018 ERCOT supply stack in Exhibit ER-5 (in the report), breaks out the coal-to-gas relationship, as well as their relationship to other generating sources, with increasing granularity.
The report also includes price sensitivity analysis, monthly coal and gas burn, regional analysis, and other valuable insights. Follow the link to download a sample or to learn more about EVA’s Monthly Gas & Coal Price Sensitivity Outlook.