


The Natural Gas Council (NGC) released Holding the Line: U.S. Natural Gas Performance During Winter Storm Fern, an independent analysis prepared by Energy Ventures Analysis, Inc. (EVA), examining how the U.S. natural gas system performed during the approximately two-week Arctic outbreak that affected an estimated 230 million people across North America from January 23 to February 1, 2026. The report was commissioned by NGC and its member organizations: the American Gas Association (AGA), American Petroleum Institute (API), Independent Petroleum Association of America (IPAA), Interstate Natural Gas Association of America (INGAA), and the Natural Gas Supply Association (NGSA).
What distinguished Winter Storm Fern was the duration, not peak severity. Sustained below-normal temperatures over more than ten consecutive days drove Lower-48 demand to 167 Bcf/d on January 24, the fifth-highest single-day level on record, with 12 of the top 25 all-time demand days occurring during the storm window. Electricity demand across the Central and Eastern U.S. peaked at over 500 GW on January 27, with natural gas serving as the primary fuel in nearly every affected power market.
The natural gas system met the challenge. Appalachian output remained within 10% of pre-storm highs for virtually the entire storm, versus a nearly 30% decline during Winter Storm Elliott under comparable temperatures, and Lower-48 production recovered to within 5% of pre-storm levels in just three days, compared to five days during Elliott and more than eight during Uri. These results reflect cumulative market-driven weatherization investments across the supply chain since 2021.
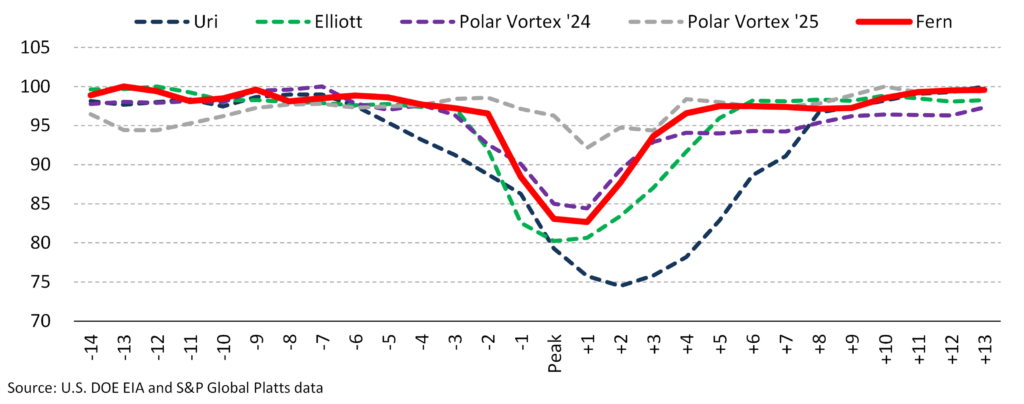
Normalized Lower-48 Natural Gas Production During Fern Vs Previous Cold Weather Events
Storage and LNG flexibility were equally decisive. Underground storage withdrawals peaked at approximately 63 Bcf/d, supplying roughly 40% of national gas demand at the height of the event, and the week ending January 30 set an all-time weekly withdrawal record of 360 Bcf. LNG export terminals cut feed gas intake by approximately 44% at peak, redirecting volumes to domestic markets. No natural gas utility reported a loss of service to firm customers.
Despite this resilience, constrained Northeast pipeline infrastructure transformed a modest supply disruption into one of the most extreme regional price spikes ever recorded, with Iroquois Zone 2 exceeding $175/MMBtu on January 28. Prices corrected rapidly once production data confirmed Appalachian production output had held steady, underscoring that the spike reflected an infrastructure constraint and market sentiment at the time, not a supply-demand imbalance. Additionally, EVA’s modeling shows monthly average prices at key Northeast hubs would have been 10–20% lower had four delayed or canceled pipeline projects been built: Access Northeast, Northeast Supply Enhancement, PennEast, and Constitution Pipeline.
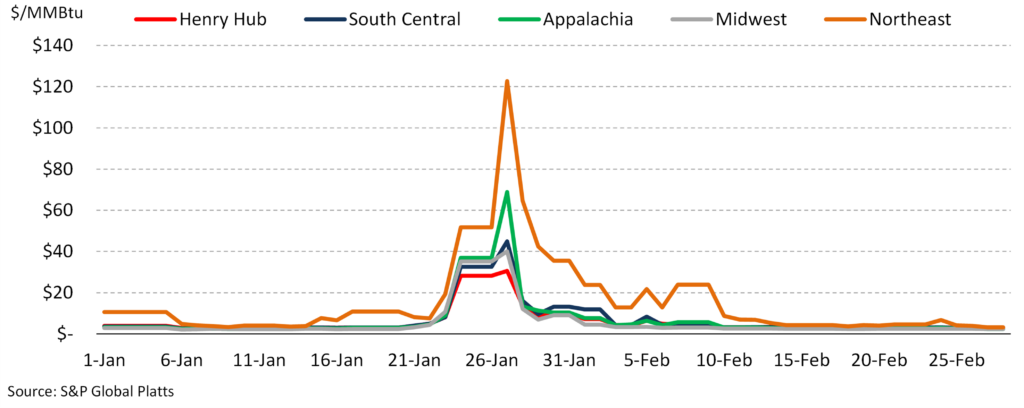
Average Day-Ahead Natural Gas Prices By Region
Working gas storage capacity and deliverability in market areas have effectively stagnated for at least a decade, while supply and demand have grown by nearly 50%, leaving a smaller buffer against sustained demand surges. In conclusion of its analysis, EVA and the NGC recommend expedited permitting of pipeline and storage projects in constrained regions; frameworks that protect critical gas infrastructure from electric load-shedding; electric market design reforms that require generators to hold firm gas capacity; and treatment of market-area storage expansion as a reliability investment equivalent to new pipeline capacity.
To access the full report, please check out Holding the Line: U.S. Natural Gas Performance During Winter Storm Fern.
Energy Ventures Analysis (EVA) is a leading provider of consulting and analytical services for the energy industry. With decades of experience, EVA delivers in-depth market analysis, strategic insights, and expert advice to support decision-making in the energy sector.