


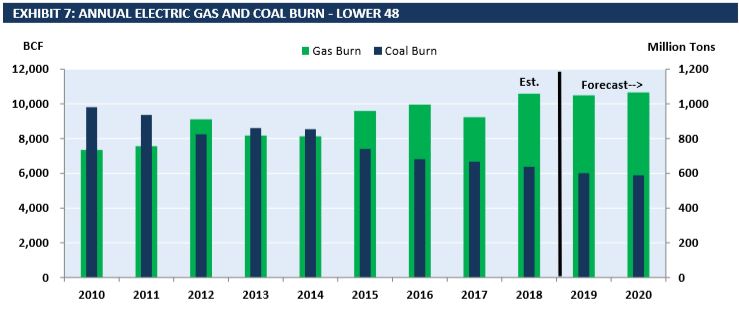
EVA’s monthly Gas & Coal Price Sensitivity Outlook shows that December gas burn actualized at 23.9, bringing the annual 2018 gas burn to roughly 29 BCFD—a record high. Coal burn declined YoY, falling to around 637 million tons in 2018. Only four years ago coal burn was above 800 million tons, highlighting how retirements and market dynamics have rapidly reduced the role of coal in the generation mix. 2018 was a big year for gas, which claimed 34% of total generation in 2018 after making up 31% of total generation in 2017. Wind and solar generation made up nearly 10% of total generation in 2018. Exhibit 7 from the report depicts that EVA’s forecast expects coal burn to decline below 600 million tons in the next two years, while gas burn should remain steady.
Overall demand was low in December 2018 YoY. The below table breaks out December and YTD supply and demand and compares it to 2017. YoY gas generation (and to a lesser extend wind and solar) displaced significant coal generation and made up for a lower hydro year. Wind and solar generation are expected to continue to grow in the short term, and it will be interesting to see if they displace any of 2018’s gas generation. (EVA’s forthcoming Renewable Report focuses on regional wind capacity factors impact coal and gas burn on a monthly basis)
For our public release of our March report we want to highlight market dynamics in the PJM RTO. Since 2010 PJM has seen a dramatic switch between coal and gas in the generation mix. Coal generation fell by 20% YoY in December and is expected to decline further as 3.4 GW of capacity is anticipated to exit the market in the next two years. Gas capacity additions will slow to about 2.4 GW through 2020, after a record 11 GW of capacity additions in 2018, Exhibit PJ-2 reflects exactly this trend.
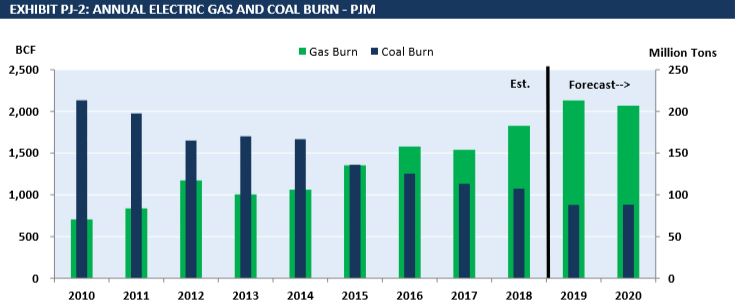
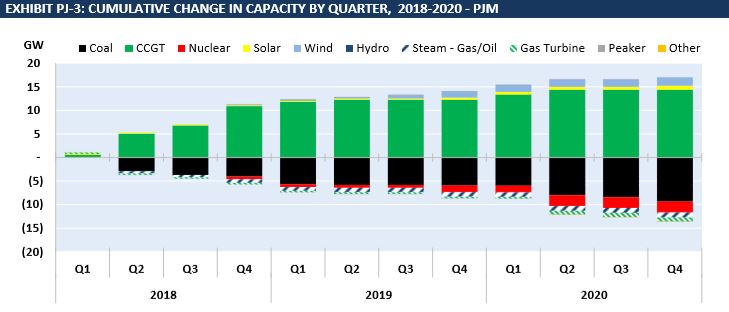
Exhibit PJ-3 breaks out what those capacity changes look like in the PJM region. Notably, in the short-term coal and nuclear retirements are being offset by a growing CCGT fleet.
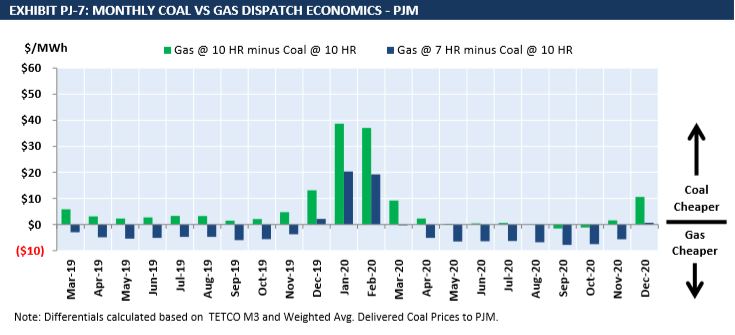
EVA’s analysis of the monthly dispatch economics (below in Exhibit PJ-7) finds that CCGTs in PJM are generally cheaper than coal throughout the year, but gas turbines are moderately less economic than existing coal generation through April 2020. Significant changes in delivered coal or gas prices could have a major impact on the dispatch economics, especially because the margins are so close for most months through 2020.
EVA’s monthly Gas and Coal Sensitivity Outlook combines these kinds of regional coal and gas insights with our proprietary weather-normalized price sensitivity scenario analysis. To find out more about this report and our other offerings follow the link or contact us at eva [at] evainc [dot] com.