COVID-19 and Mild Weather Combine to Suppress Electricity Demand
Electricity demand in the continental U.S. since the beginning of the year has been sharply lower than during the same period in 2019, though the response to the ongoing COVID-19 virus pandemic is only partially to blame. Demand across the six largest centrally-dispatched markets – PJM, the Midcontinent ISO, ISO New England, New York ISO, ERCOT, and the California ISO – was 4.8% lower through the first 95 days of the year. During January and February, the decline can be attributed almost entirely to mild weather since the pandemic had not yet affected the U.S. For the full quarter, PJM showed the most aggressive decline at 7.1%, while demand in ERCOT was roughly 0.7% higher year-over-year thanks to a cold February. Exhibit 1 contains a table showing the year-over-year change in electricity demand for these markets. These markets collectively represent nearly 60% of the nation’s electricity demand.
Exhibit 1: Year-over-year change in electricity demand in various ISOs
Source: ISO data, EVA analysis
The data indicates that with the exception of ERCOT and CAISO, the year-over-year demand declines accelerated in March. This coincided with states beginning to respond to the growing COVID-19 pandemic by issuing shelter-in-place orders, which resulted in many businesses closing their doors indefinitely. At the same time, average temperatures across the six ISOs were 6-8 degrees Fahrenheit higher than in 2019, which significantly reduced heating demand and made the impact of COVID-19 appear more drastic. Total degree days (TDD) across those six markets were down by an average of 15% year-over-year. Exhibit 2 contains a table of the change in average temperatures and total degree days for the six ISOs.
Exhibit 2: Year-over-year change in average temperature and total degree days in various ISOs
Source: Frontier Weather, EVA analysis
To isolate the impact of COVID-19 on electricity demand, EVA analyzed the weather-adjusted electricity demand across these six markets. The substantial year-over-year drop in TDDs in March, which averaged 23%, makes the adjustment difficult to perform. In all markets except ERCOT, the decline in TDDs considerably outpaced the decline in electricity demand. For example, data for PJM demand implies year-over-year weather-adjusted demand growth of 29%, which does not comport with the grid operator’s own observations. In its latest weekly COVID-19 update call, PJM estimated that its load is roughly 5-7% lower than historical trends suggest it should be, though that delta is expected to widen further. It also projected that industrial demand, which makes up 26% of the ISO’s total demand, will be less impacted than commercial demand, though that may vary by state. PJM covers a large and geographically diverse region, and the governors of all 13 states that make up its territory have issued shelter-in-place orders. The grid operator in late March noted that its hourly demand profile now resembles that of a typical snow day given the reduced demand load related to closed businesses.
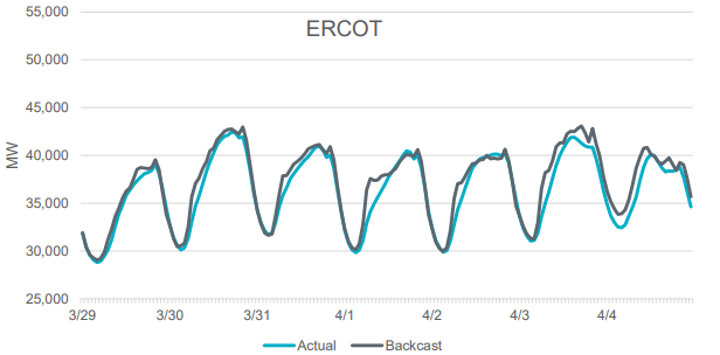
In ERCOT, electricity demand in March was 1.4% higher year-over-year despite a 20% decline in TDDs, which would suggest a 27% increase in weather-adjusted demand. Again, this does not comport with the COVID-19-related load observations that ERCOT released. The grid operator highlighted that while its daily peaks have changed little, its morning load (6am to 10am) has been consistently 6-10% lower than what its models predict. This change in load ramping is consistent with fewer people going to work each day. ERCOT also reported that weekly energy usage has been down about 2% over the past two weeks. Exhibit 3 contains two charts showing the results of ERCOT’s backcast model and the actual electricity demand as well as a second chart highlighting the difference between the two. The data emphasizes how the morning periods have been consistently lower than expected given actual weather conditions, but peaks have shown little change – particularly on hot days.
Exhibit 3: ERCOT’s backcast model versus actual load

Source: ERCOT
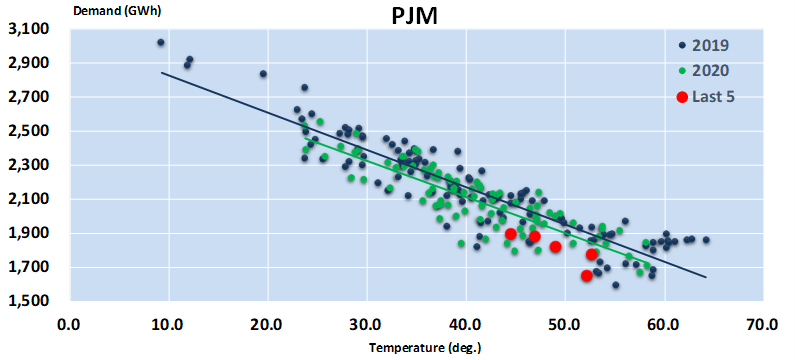
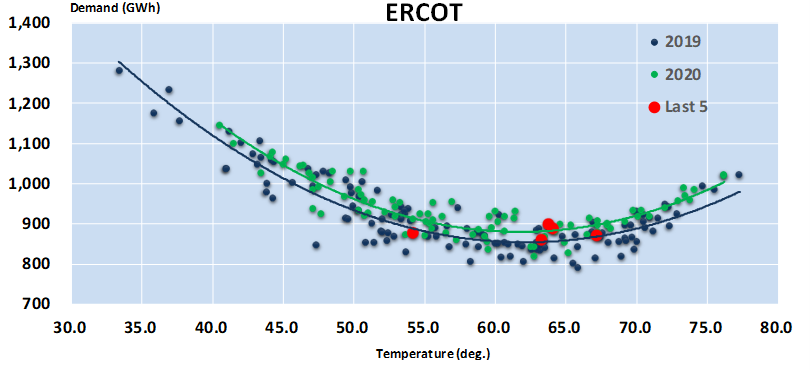
While EVA believes most of these declines are due to the impact of COVID-19, some incremental energy efficiency and distributed generation may also be reducing demand. Exhibit 4 contains scatterplots showing daily average temperature and electricity demand for the first 95 days of 2019 and 2020.
Exhibit 4: Daily average temperature and total electricity demand in various ISOs


Source: ISO data, Frontier Weather, EVA analysis
The data indicates that in PJM and the New York ISO, year-to-date electricity demand is below that of 2019 when controlling for weather. Zeroing in on the past five days (first five days of April), demand is well below what has been observed at similar temperatures, which indicates that the shelter-in-place orders and shuttered businesses are impacting electricity usage patterns. While sector-specific data is not yet available, EVA believes that the commercial sector is accounting for a disproportionate share of the decline given that many restaurants and stores are closed. Residential demand, however, may be up slightly as people are confined to their homes. New York is the state that has been hardest hit from the virus, and an analysis from NYISO indicates that demand in Zone J, which covers New York City, was as much as 18% below expected levels at the beginning of April.
In ERCOT, the data indicates that weather-adjusted demand has been slightly higher year-over-year. This may be due to economic growth in the state, particularly considering the strong gas and oil production in West Texas. The curve is a different shape in ERCOT because warm weather arrives earlier in the year in Texas and induces some cooling demand.
The trends in this report are those that EVA has observed and not necessarily what it forecasts for the future in any of the markets mentioned. EVA is well-equipped to perform electricity demand sensitivities as well as other scenario analysis that stresses commodity prices, new builds, or any market driver that may be impacted by the COVID-19 pandemic. Please contact [email protected] with questions.


