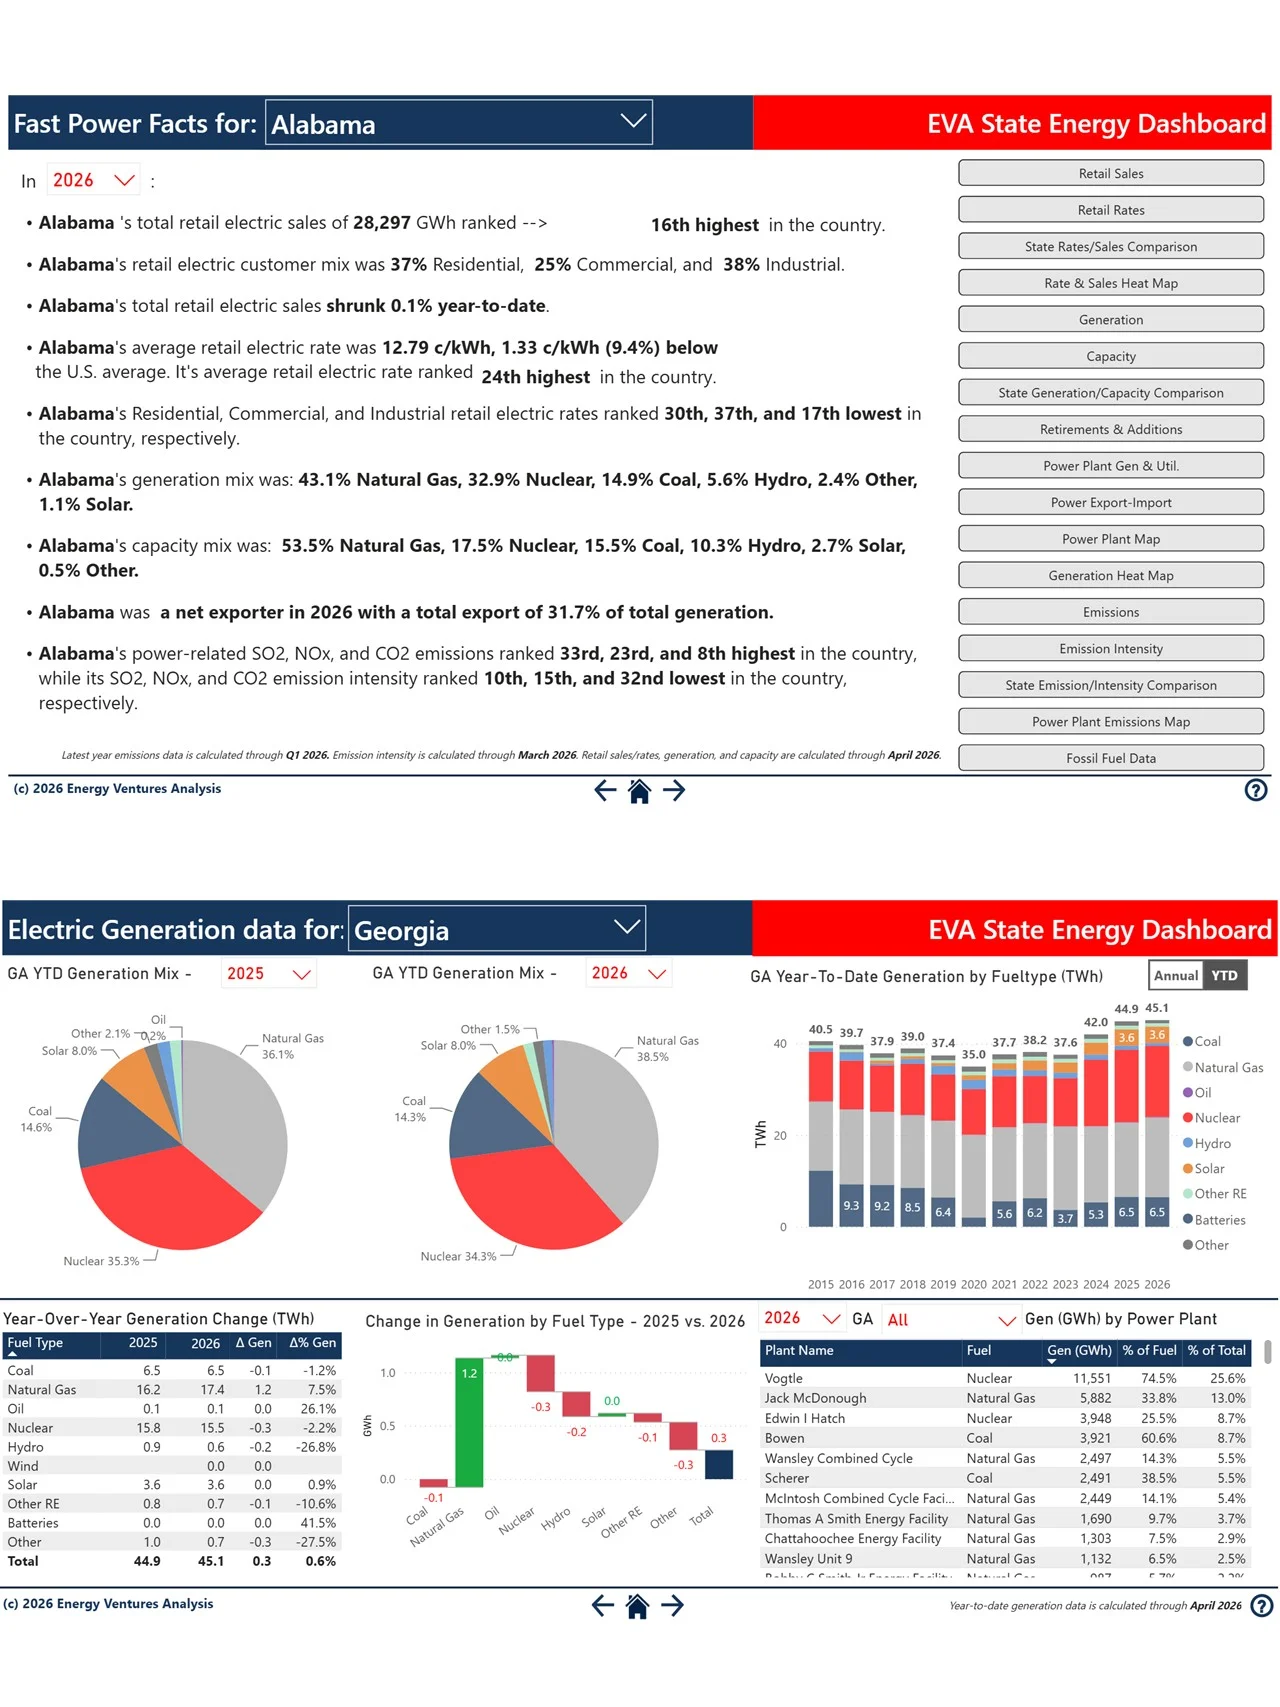
EVA’s State Energy Dashboard is an interactive Power BI tool covering the full picture of each state’s electric power sector, drawing on EIA Forms 923, 860, and 861 alongside EPA Clean Air Markets emissions data. All 50 states and D.C. are accessible through a single state selector, with data presented on an annual basis going back a decade and updated monthly to reflect current year-to-date figures. Each state view opens with a Fast Facts summary showing key metrics — generation and capacity mix, retail sales rank, average rate vs. the national average, import/export status, and emissions rankings — with deep-dive pages available for every data category.
The dashboard includes:
- Retail electric sales: Annual and YTD total and sector-level (residential, commercial, industrial) sales in TWh, year-over-year changes, national rankings, and utility-level breakdowns from EIA Form 861.
- Retail electric rates: Average rates by sector in nominal and real terms, trended against the U.S. average, with state-to-state comparison rankings and utility-level rate data.
- Rate and sales heatmaps: National maps ranking all states by total sales volume, average rate, or sector share, filterable by year and customer class.
- Generation and capacity: Annual and YTD generation and installed capacity by fuel type over the trailing decade, with year-over-year change tables, plant-level generation rankings, and state-vs.-state comparison charts by fuel type and share.
- Capacity retirements and additions: Historical and current-year plant additions and retirements by fuel type, with plant-level detail including utility name, online or retire date, and capacity in MW.
- Power plant generation and utilization: Capacity factor data by fuel type and individual plant, trended annually and ranked against all other states.
- Power export and import: Full-year estimated electricity trade balances showing net generation, adjusted retail sales, and export/export percentage by year, with a national map classifying each state as exporter, importer, or self-sufficient.
- Interactive power plant maps: Plant-level maps sized by generation or capacity, color-coded by fuel type, with utility and plant name filters.
- Emissions and emission intensity: Annual and YTD power sector SO2, NOx, and CO2 emissions by fuel type and plant from EPA CAMPD data, with year-over-year comparisons and national state rankings for both total emissions and emission intensity.
- Fossil fuel consumption and delivered costs: Annual and YTD coal, natural gas, and petroleum consumption in physical units and MMBtu, with average delivered fuel costs by fuel type and plant from EIA Form 923.
For a limited time only, the U.S. State Energy Dashboard can be accessed for free here: Access EVA’s U.S. State Energy Dashboard