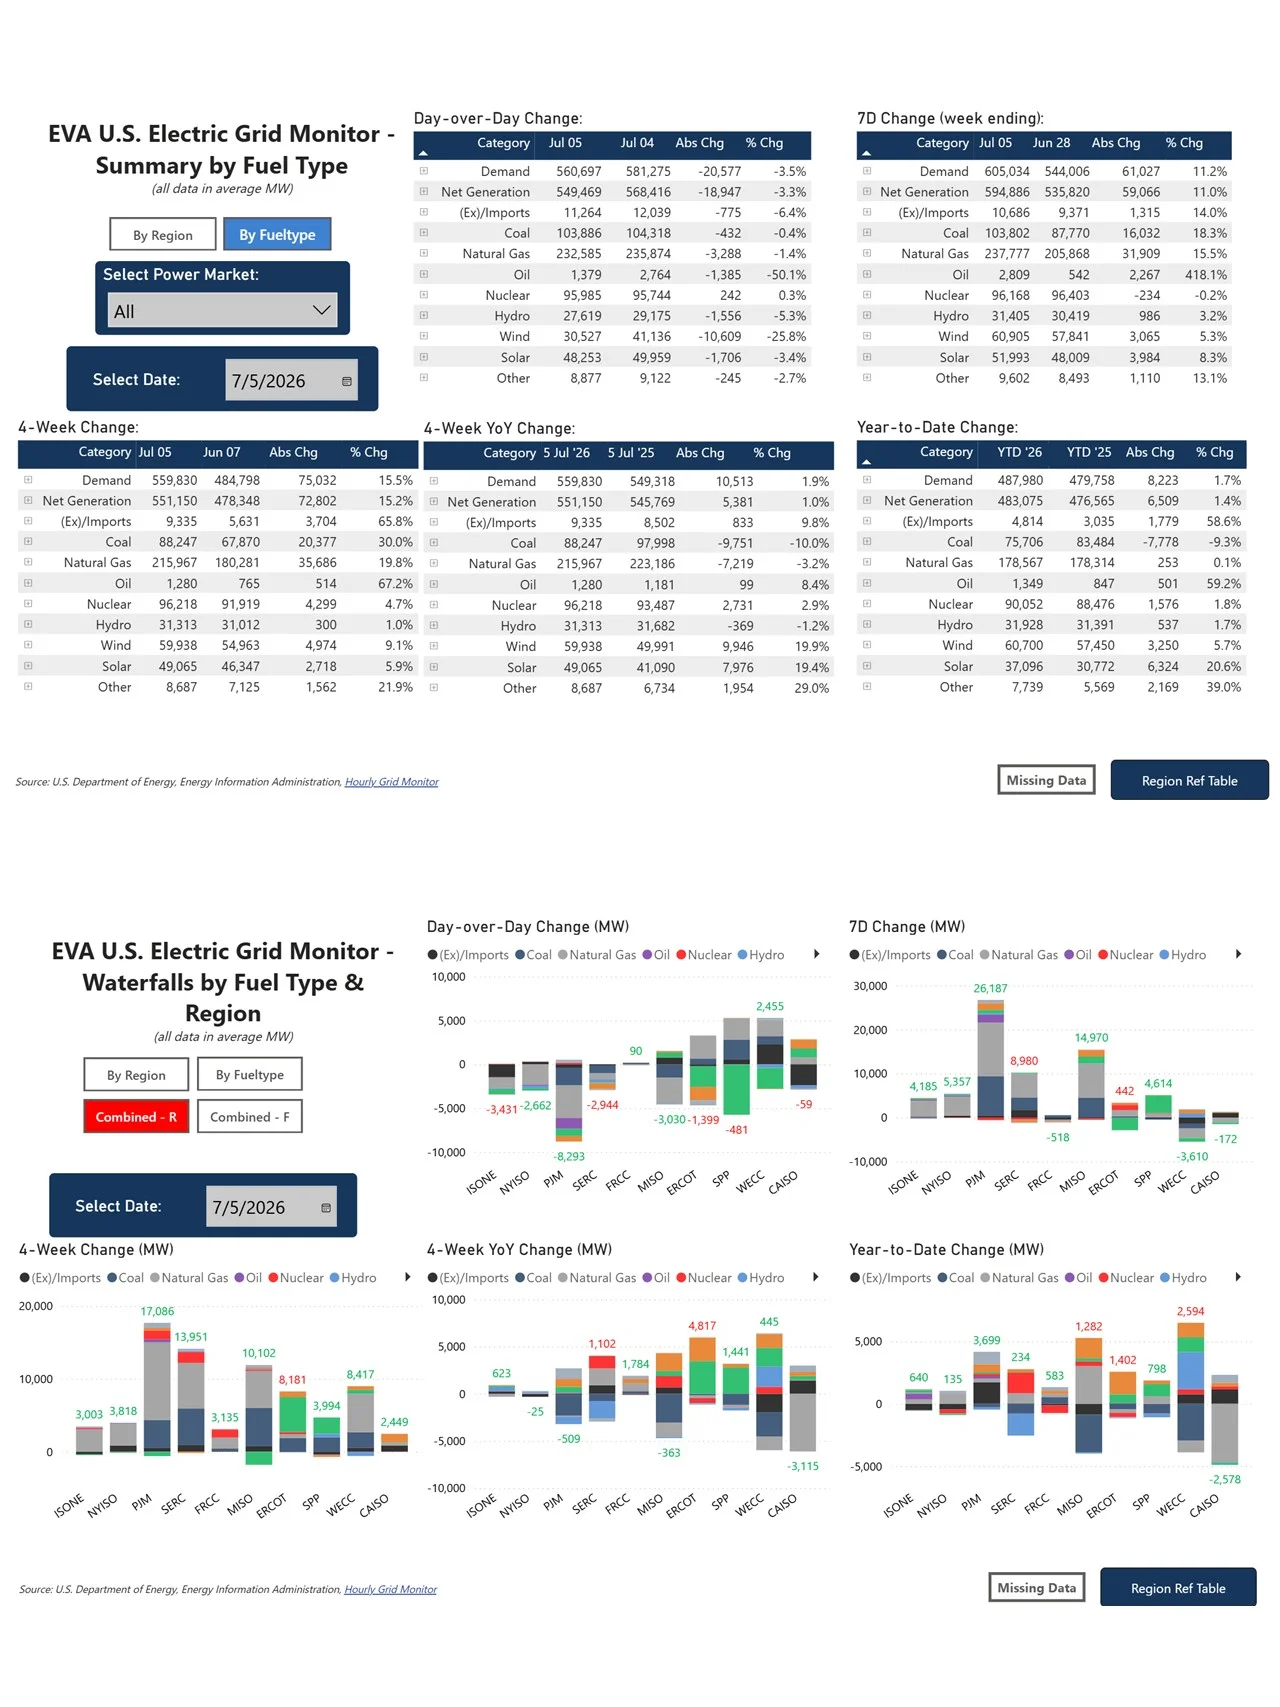
EVA’s U.S. Electric Grid Monitor is an interactive Power BI dashboard that pulls hourly generation and demand data directly from EIA’s Form 930 Hourly Grid Monitor, updated multiple times daily. The tool allows users to slice data by power market, balancing authority, and fuel type across a range of time horizons, from day-over-day comparisons to year-to-date trends spanning five years of history.
The dashboard includes:
- Generation and demand summaries: Day-over-day, week-over-week, 4-week, month-over-month, year-to-date, and 4-week year-over-year comparisons of net generation, demand, and net imports/exports across all fuel types and major U.S. power markets (ISONE, NYISO, PJM, SERC, FRCC, MISO, ERCOT, SPP, WECC, and CAISO).
- Waterfall charts by region and fuel type: Visual breakdowns of generation changes across markets and fuel categories, with absolute and percentage changes for each time period.
- Trend lines: Daily and 7-day moving average generation trends for each fuel type, plotted against five-year historical averages and ranges for seasonal context.
- Installed capacity tracking: Month-over-month and year-over-year capacity changes by fuel type drawn from EIA Form 860 monthly data, including YTD average capacity comparisons.
- Capacity factor data: Day-over-day through year-to-date capacity factor tables and charts by fuel type, with weekly average trend lines over the trailing 8-week and 12-month windows.
- NOAA temperature anomaly maps: Daily, weekly, and month-to-date mean temperature departure maps sourced from NOAA’s National Centers for Environmental Information, providing weather context for demand and dispatch analysis.