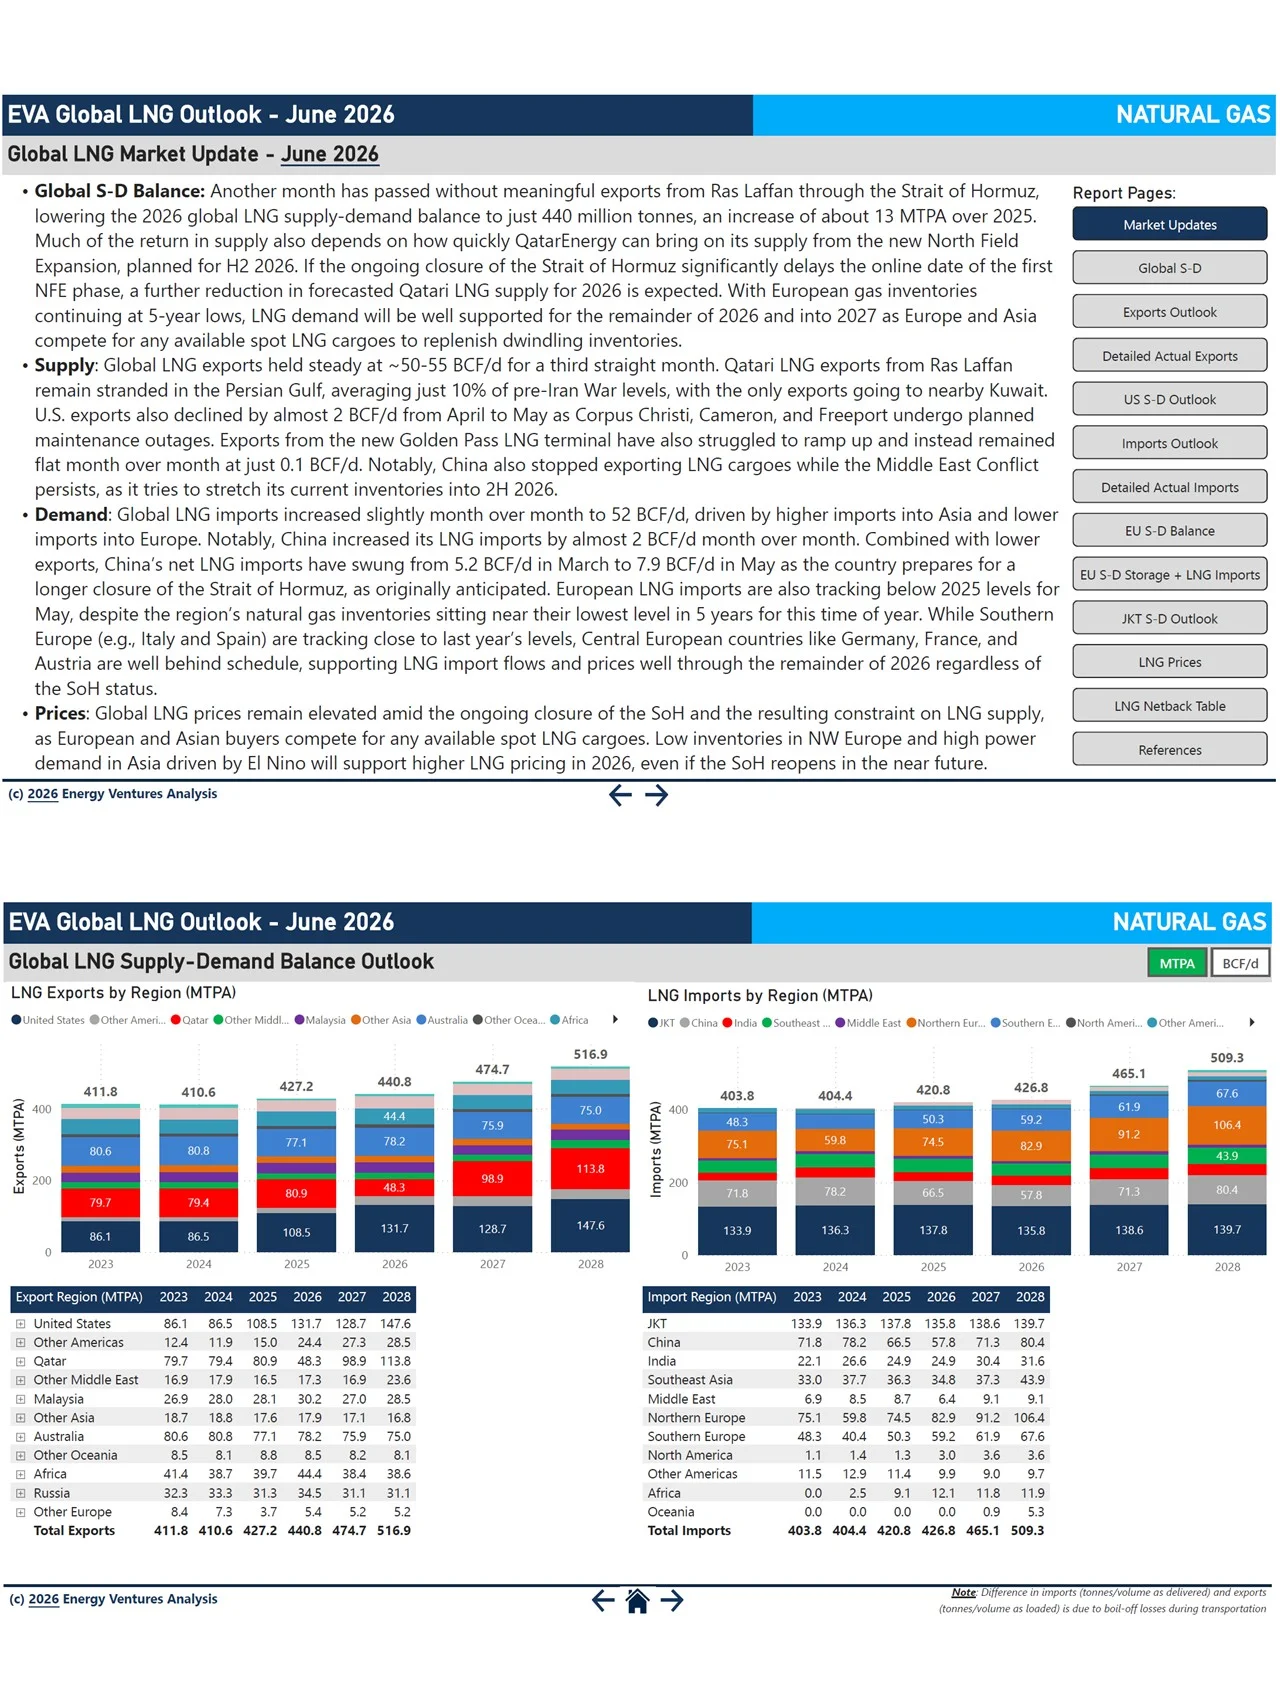
EVA’s Monthly Global LNG Outlook delivers comprehensive coverage of the global LNG market, combining a fully interactive Power BI dashboard with a static PDF summary and a linked Excel data file. The Power BI interface allows subscribers to filter, drill down, and explore data across countries, terminals, and time periods — making it a highly flexible tool for traders, analysts, and planners who need to interrogate the data on their own terms.
As U.S. LNG exports have grown into a dominant force in global gas markets, EVA’s report provides the integrated view needed to track how domestic supply dynamics, geopolitical developments, and shifting demand from Europe and Asia interact to drive market outcomes.
Each monthly edition covers:
- Global LNG supply-demand balance outlook with a three-year forward forecast covering exports and imports by region and country
- LNG export outlook by terminal and country, including capacity, actual exports, utilization rates, and feedgas flows for all U.S. terminals
- LNG import outlook by country and terminal, with monthly actuals and forward forecasts across all major import regions
- European natural gas supply-demand balance, storage levels by country, power generation mix, and LNG import flows
- Japan-Korea-Taiwan (JKT) natural gas supply-demand balance, LNG storage levels, and power generation mix
- Global LNG price outlook, including Henry Hub, JKM, TTF, and Brent comparisons, plus U.S. LNG netback calculations to both NW Europe and NE Asia
- Key market narrative covering supply disruptions, demand shifts, pricing dynamics, and geopolitical developments affecting the global LNG trade