PJM released the results of its 2028/2029 Base Residual Auction (BRA) on July 14, 2026, and the outcome continues a pattern now seen in three auctions in a row. Capacity cleared at $325.00/MW-day across the entire RTO footprint, the FERC-approved price cap for this auction cycle, and a modest decline from the $333.44/MW-day cap that applied to the 2027/2028 BRA. But the price itself is less telling than what lies behind it: PJM’s reliability requirement continues to outpace the capacity available to meet it, and this is now the third straight delivery year in which the auction has cleared meaningfully below target reserve margins.
Auction Results
The 2028/2029 BRA cleared 138,318 MW of Unforced Capacity (UCAP). Combined with roughly 10,864 MW committed through the Fixed Resource Requirement (FRR) alternative, total procured capacity across the RTO came to about 149,182 MW, or 6,831 MW below the RTO Reliability Requirement, essentially unchanged from the 6,516 MW shortfall in the 2027/2028 BRA. The auction cleared at a 14.4% Installed Reserve Margin (IRM) against a 20% target, the second consecutive auction more than a full percentage point below target.
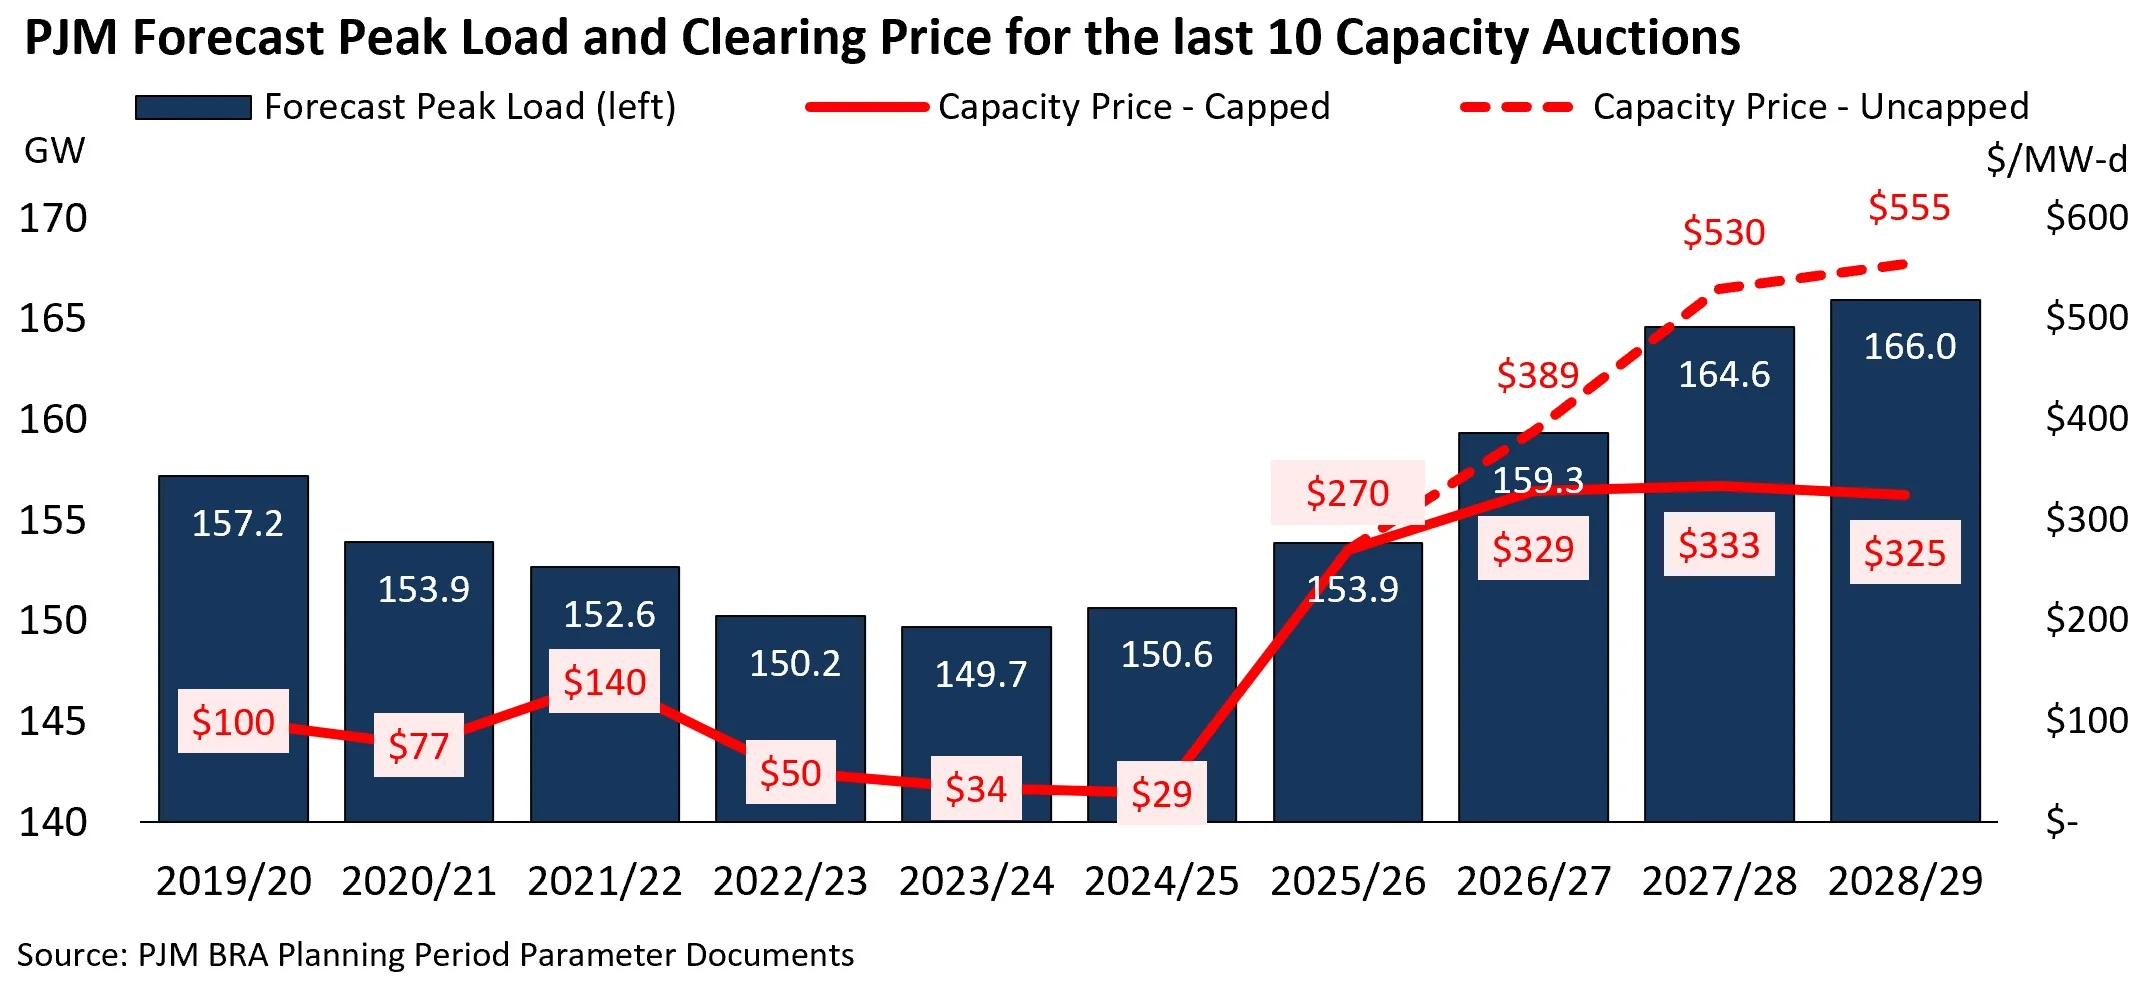
PJM Forecast Peak Load and Clearing Price for the last 10 Capacity Auctions
As in the prior two auctions, the RTO cleared at a uniform system-wide price, with no zone-specific price separation due to the shortfall. PJM’s companion simulation of an uncapped auction is worth noting: absent the cap, the system-wide price would have reached roughly $555/MW-day, with the COMED zone binding separately above $775/MW-day. Cleared UCAP in that simulation was only marginally higher than the actual result, which is the clearest evidence that the constraint in this market isn’t price sensitivity so much as the physical amount of capacity available to sell.
What’s Driving the Persistent Gap
A handful of factors, largely carried over from the past two auction cycles, explain why the shortfall hasn’t closed. PJM’s reliability requirement rose again this year to 156,013 MW UCAP from 152,400 MW, driven by a 1,375 MW increase in forecasted load, largely tied to continued growth in large loads such as data centers. On the supply side, new generation entering the market remains thin: only 525 MW UCAP of new, uprated, or reactivated capacity cleared this auction, down from 774 MW in the 2027/2028 BRA and a fraction of the multi-gigawatt totals seen in auctions earlier in the decade.
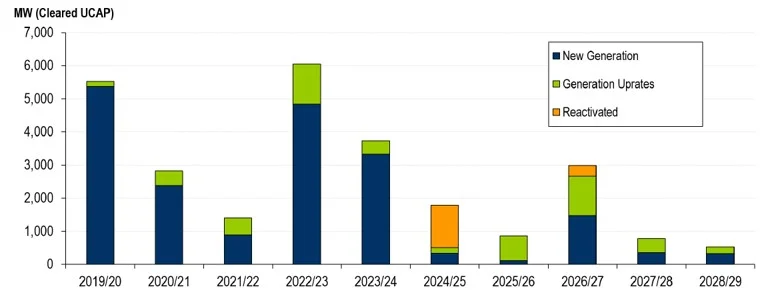
Cleared Megawatts (UCAP) by New Generation/Uprates by Delivery Year
Load growth is only part of why the reliability requirement has climbed. PJM’s target Installed Reserve Margin (IRM), the cushion of capacity above expected peak load that the auction is designed to procure, has also risen substantially over the past several auctions. The target held close to 15% through the 2023/2024 BRA, then began rising in response to reliability concerns raised by Winter Storm Elliott in December 2022 and subsequent extreme weather events: to roughly 17.7% for 2024/2025, 17.8% for 2025/2026, 18.6% for 2026/2027, and 20.0% for both 2027/2028 and 2028/2029. That’s a cumulative increase of about five percentage points in just a few years. Combined with reduced ELCC accreditation for resources like gas and solar, PJM has effectively required more capacity to be procured for the same underlying system, on top of the additional capacity that load growth alone would require. None of this reflects a change in the physical generating fleet; it reflects a recalibration of how much of a cushion PJM’s planning criteria say the system needs and how much credit each resource gets toward that cushion, both of which tighten the market independent of what’s actually being built or retired.
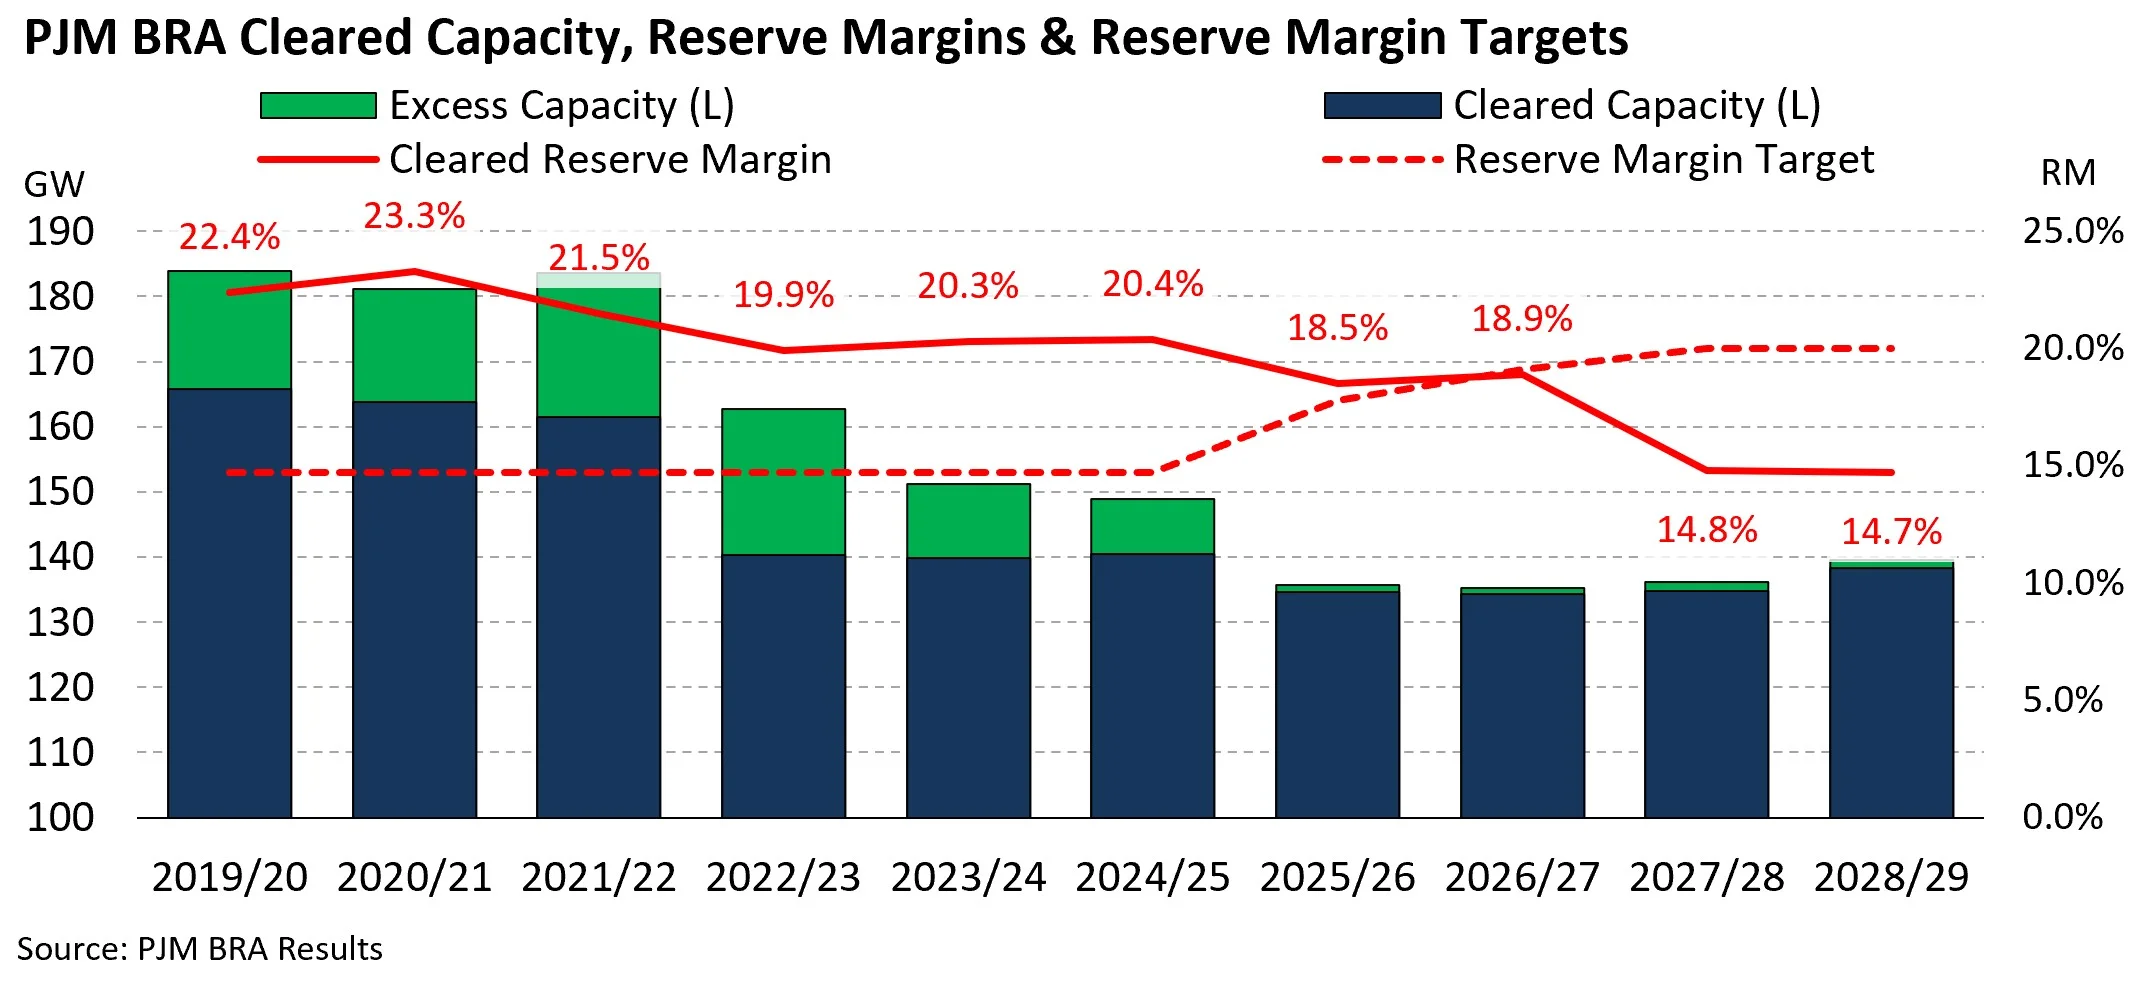
PJM BRA Cleared Capacity, Reserve Margins & Reserve Margin Targets
Retirements are also continuing on schedule even as the reserve margin runs short. AEP’s 2,600 MW Rockport power plant remains on track to retire under long-standing environmental consent decrees at the end of 2028, and while PJM has extended the Brandon Shores Reliability-Must-Run (RMR) arrangement to 2031 and delayed the Powerton retirement to at least September 2030 to preserve existing capacity in the near term, those are stopgaps rather than a change in trajectory. Gas offered into this auction did increase substantially, by roughly 5,550 MW UCAP, but that increase is mostly an accreditation effect: PJM raised the Effective Load Carrying Capability (ELCC) values assigned to gas combined-cycle and combustion turbine units after they performed well during Winter Storm Fern, which adds to cleared UCAP without reflecting new physical capacity coming online.
The ELCC-Peak Season Mismatch
That last point is worth sitting with, because it highlights a broader tension in how PJM accredits capacity. PJM’s ELCC framework assigns each resource type a single value that applies across the entire delivery year, but the underlying analysis behind those values has increasingly been shaped by generator performance during extreme winter events, Winter Storm Elliott in December 2022 and, more recently, Winter Storm Fern. Gas units that struggled with fuel availability or freeze-related outages during those cold snaps see their ELCC ratings pulled down, even though PJM’s system-wide peak load has historically occurred in the summer, when those same units generally perform well. The result is a single, blended accreditation value that can understate a resource’s actual availability during the season when PJM’s system is most often stressed, while weighting heavily toward performance during a comparatively small number of extreme winter hours.
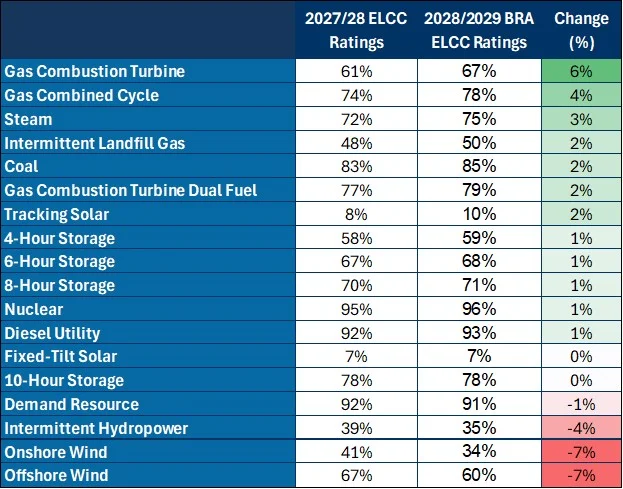
PJM ELCC Ratings by Class & Delivery Year
Solar illustrates the same mismatch from another angle. PJM’s ELCC analysis for solar has been anchored to performance during winter peak hours, which tend to fall in the early morning before sunrise, when solar output is naturally at or near zero, as evidenced by PJM’s 7% and 10% ELCC values for fixed-tilt and tracking standalone solar projects, respectively. But PJM’s peak demand still occurs predominantly on summer afternoons, when solar generation is at its strongest and most reliably available. An annual accreditation built primarily around a winter-morning risk window understates what solar can actually contribute during the summer hours, when the system is more often under stress, effectively pricing solar for the season where it performs worst rather than the season where PJM’s capacity need has traditionally been highest.
PJM isn’t alone in confronting this tension, and other RTOs have reached different conclusions. MISO moved to a seasonal resource adequacy construct beginning in 2022, replacing its single annual Planning Resource Auction with four separate seasonal auctions and seasonal accredited capacity values, explicitly to align each resource’s counted capacity with its actual availability during that season’s highest-risk hours rather than blending winter and summer performance into one number. PJM’s auction already has a seasonal element of its own: generators can offer capacity as summer-only or winter-only resources that must be matched to clear, as this auction’s 330 MW of matched summer capability shows. But the ELCC values applied to those resources remain single annual figures rather than season-specific ones. Whether PJM moves toward a more fully seasonal accreditation approach or continues refining its current annual ELCC methodology is one of the more consequential open questions regarding how accurately future auctions price the capacity PJM’s system actually needs in each season.
The Interconnection Bottleneck
Underlying all of this is a structural issue that predates any single auction: new capacity simply isn’t moving through PJM’s interconnection queue fast enough to offset load growth or scheduled retirements. Lawrence Berkeley National Lab’s most recent Queued Up analysis of U.S. interconnection queues found that the median project reaching commercial operation in 2025 took 61 months from its initial interconnection request, up from 36 months a decade earlier. FERC-jurisdictional regions like PJM continue to see longer timelines than regions such as ERCOT, which use a simpler connect-and-manage model. In fact, PJM has seen one of the largest increases in interconnection request completion times in the country. While projects that came online between 2004 and 2008 took roughly 20 months from their initial interconnection request (IR) to their commercial operation date (COD), projects that came online in 2025 took almost 80 months from start to finish, second only to projects in California.
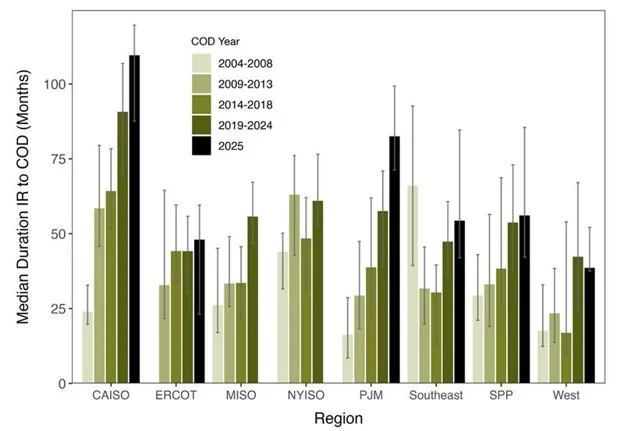
Median Duration from Interconnection Request (IR) to Commercial Operation Date (COD)
Recently, PJM has moved to a cycle-based cluster study process and introduced a fast-track option (the Reliability Resource Initiative) for high-value reliability resources. However, it is still working through a substantial backlog of pre-reform requests, and LBNL’s data show that even RRI-track projects have seen significant withdrawals. In practical terms, that means the pipeline of projects that could plausibly offer into a BRA two or three years out is thinner than the raw queue volume would suggest, and it’s a large part of why the reserve margin gap has proven durable across three auctions rather than a one-time event.
Looking Ahead
PJM has acknowledged the pattern and is working through its stakeholder process to address changes to reliability backstop procurement and large-load interconnection. Those efforts may improve visibility and process speed over time, but they don’t add megawatts on their own. Closing the gap will ultimately depend on how quickly new supply, gas, solar, and storage projects already sitting in the interconnection queue can be converted into cleared capacity, and on whether load growth from large loads moderates or continues to accelerate. Absent a meaningful shift in either of those two variables, the results of this auction look like a reasonable baseline for what to expect in the next one.
If you’d like to talk through what these results mean for your planning, reach out to our team.
This post is based on PJM’s official 2028/2029 Base Residual Auction Report (July 14, 2026) and Lawrence Berkeley National Lab’s Queued Up: 2026 Edition.